Analyze · Convert · Deliver
BI Migration —
from analysis
to production,
automated.
Antares analyzes your estate, auto-converts dashboards, and backs it with expert delivery — migrations in weeks, not years.
Read-only analysis. No environment changes. No commitment.
You cannot migrate what youhaven't analyzed.
How Antares Works
A structured process.
No surprises.
Scan
Connect Tableau or upload workbooks for a fast inventory of every dashboard, calculation, and data source.
Analyze
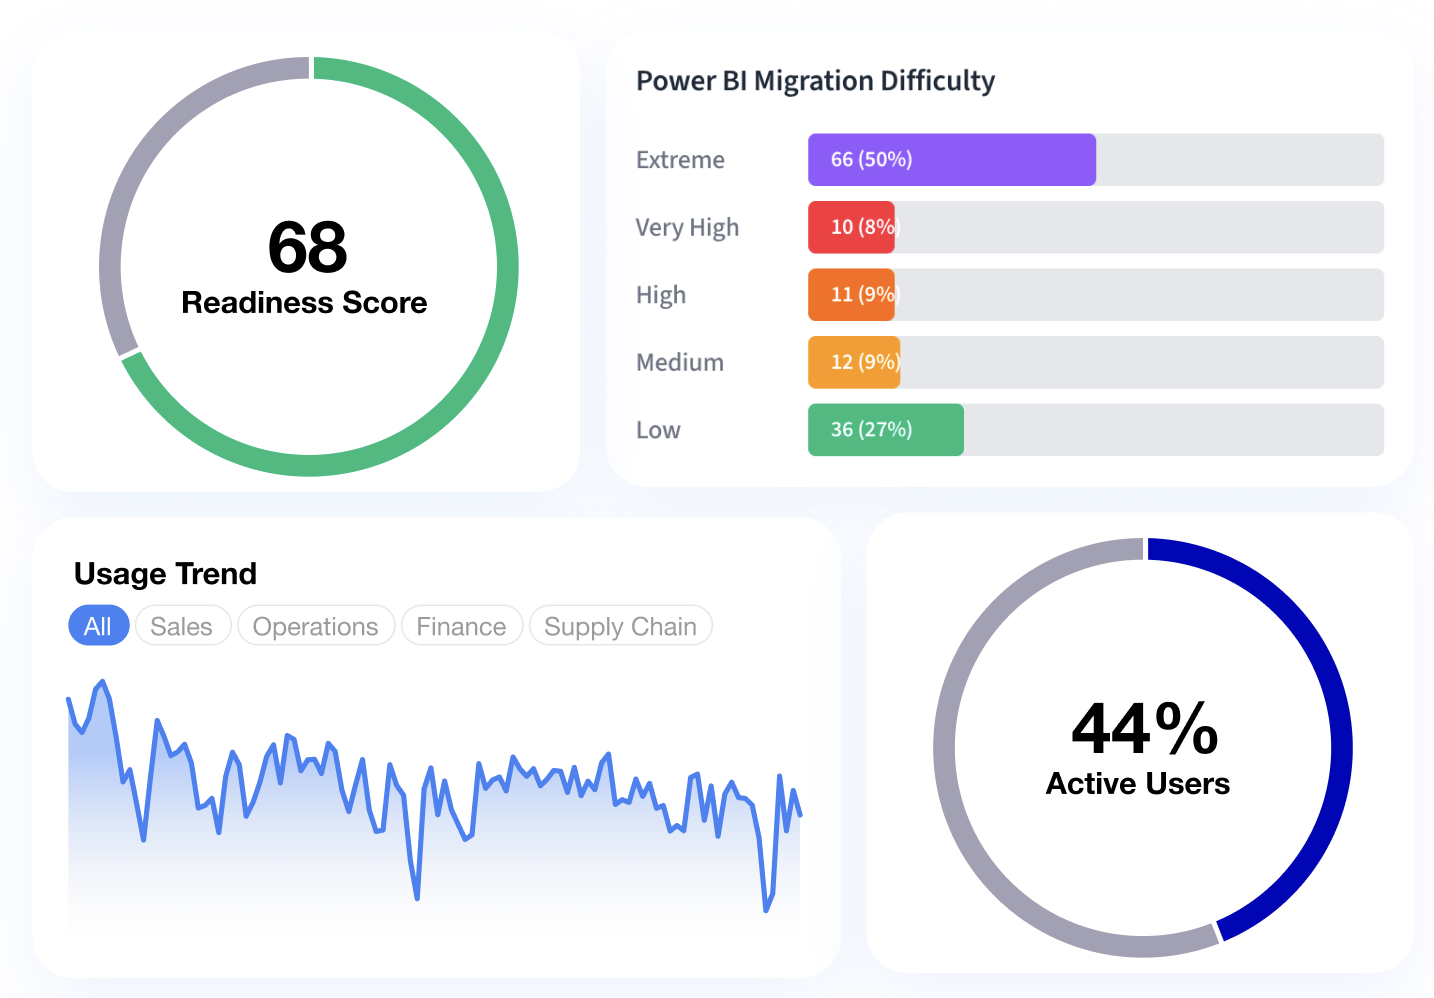
Surface blockers, usage, and feature-level risk — with a Migration Readiness Score per workbook.
Plan
A timeline and execution roadmap that align stakeholders before any code moves.
Convert
Automate the repeatable conversion and validate outputs — Antares handles what's mechanical so your team handles what isn't.
Migration Paths
Where are you headed?
Every supported route, at a glance. Hover a tool to trace its paths.
 Tableau
 Power BI
 QlikPower BITableau
 Databricks AI/BITableaufrom
- Power BIAvailable now
- Databricks AI/BIAvailable now
Power BIfrom- TableauPrivate beta
Qlikfrom- TableauComing soon
- Power BIComing soon
- Databricks AI/BIComing soon
 SAS VAfrom
Analyzer
See what you're migrating
Before you commit to anything, understand exactly what you're working with. Free analysis, complete visibility.
Example data. Not a claim.
- Complexity scoring for every dashboard
- Usage analytics to surface high-value content
- Prioritization by impact vs. effort
- Dependency mapping to avoid surprises
- Effort estimates you can plan around
Example data. Not a claim.
Converter
Automated BI conversion. In three steps.
Antares automates the bulk of the conversion work — weeks of manual rebuilding, done in days.

Partners
Need full-service delivery?
Antares automates the technical conversion — our delivery partners handle end-to-end project management, change management, and custom work.

Engagement Model
Start free. Scale with confidence.
Begin with a free analysis. Expand to automated conversion or full professional delivery when you're ready.
Start here
Analyzer
Free
Complete estate visibility before you commit to anything.
- Readiness scores for every workbook
- Complexity & risk analysis
- Usage analytics & prioritization
- Effort estimation & timeline
- Dependency mapping
Scale
Antares Converter License
License
Automated conversion at scale. Turn workbooks into production-ready targets in clicks.
- Everything in Analyzer
- One-click dashboard conversion
- Smart Tableau-to-DAX mapping
- Layout & design preservation
- Validation against source data
Full service
End-to-End Migration
Custom
Full-service migration with our delivery partners — strategy, conversion, testing, deployment, and change management.
- Everything in Converter
- Dedicated partner delivery team
- Custom migration strategy
- Change management & training
- Post-migration optimization
Migration Library
In-depth resources for BI migration
Technical guides, checklists, and deep dives for migration teams.
Let's talk migration.
Get your free Migration Readiness Score, or talk to our team about end-to-end delivery.