Analyzer
See exactly what you're migrating — before you commit.
Free, read-only analysis. A full inventory of your BI environment in minutes — what to migrate, what to fix, and what to leave behind.
No environment changes. No commitment.
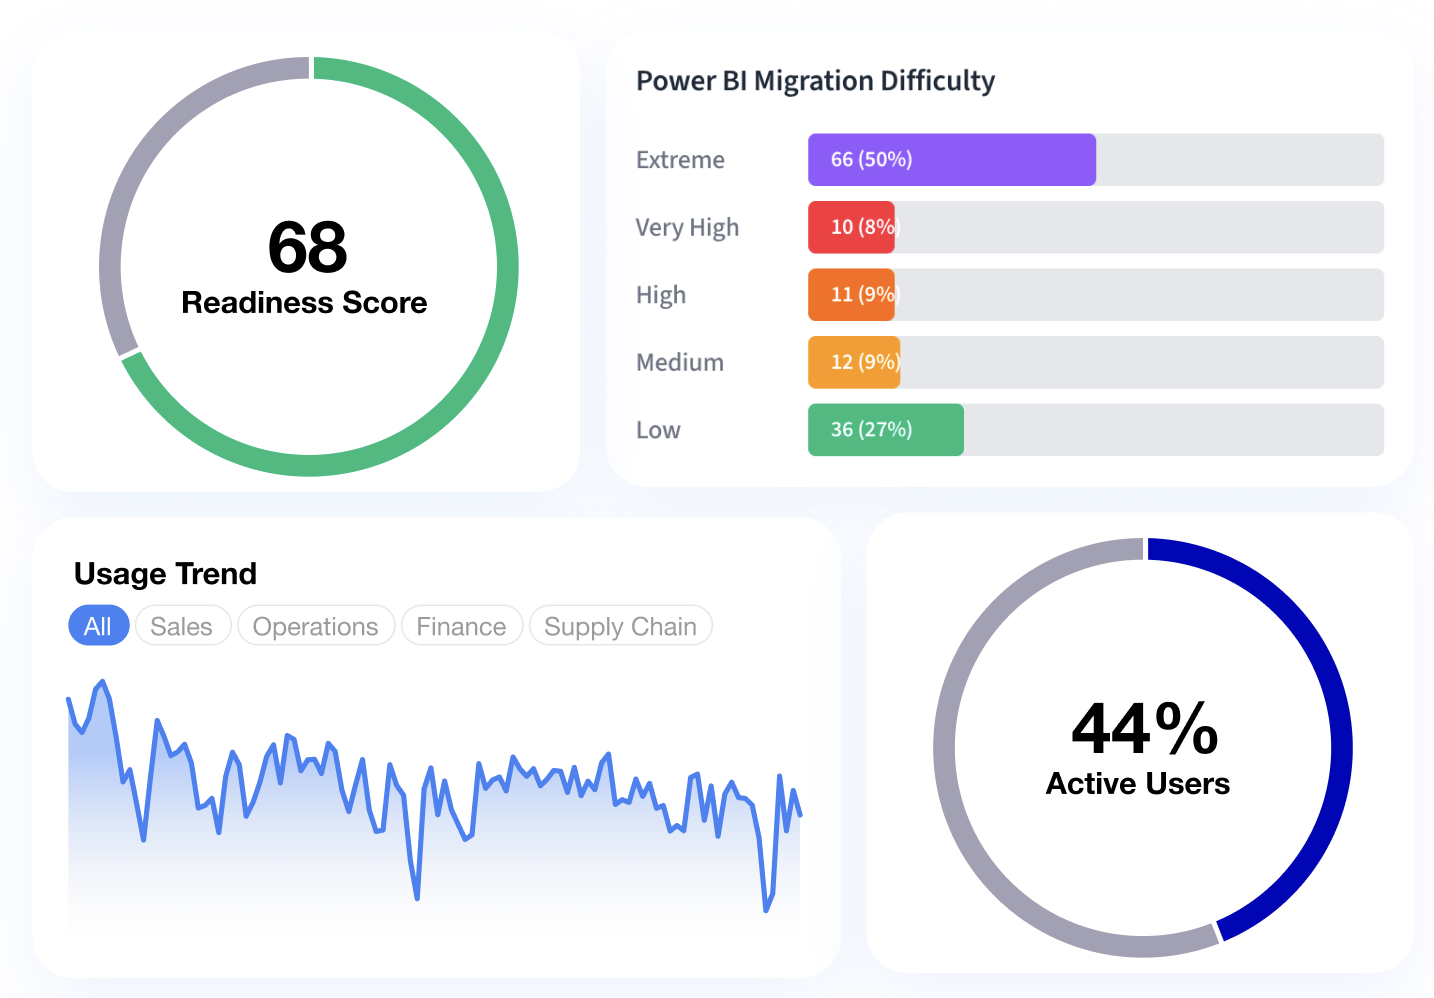
Example data — not a customer environment.
What Antares analyzes
Every platform’s hard parts — accounted for.
Each BI platform has its own quirks. The Analyzer accounts for them — and scores every workbook and report on how hard it will be to move.
Tableau
Hardest to migrate
- LOD expressions (FIXED / INCLUDE / EXCLUDE) — implicit granularity must be re-expressed downstream; every occurrence is counted and scored.
- Data blending — blends aren't joins; flagged wherever the target needs an explicit data model.
Needs attention
- Table calculations — partition and addressing semantics differ from window functions.
- Custom SQL — dialect-specific SQL is detected and rated for portability.
- Dashboard actions & filters — conditional and interaction logic is inventoried per dashboard.
- Row-level security — user-filter logic is surfaced for role mapping on the target.
Straightforward
- Calculated fields & measures — standard aggregations map cleanly.
- Parameters — cataloged with every downstream reference.
- Sets, groups, bins & hierarchies — structural objects enumerated and carried over.
Power BI
- Calculation groups & field parameters — Dynamic measure and field switching has no direct equivalent on the target — flagged for a rebuild.
- Custom visuals — Custom visual packages don’t run outside Power BI, so each one is flagged for a rebuild.
- DAX with complex filter context — Context‑sensitive DAX is rated by difficulty and matched to its nearest pattern on the target.
- Bookmarks & drillthrough — Saved states and drillthrough filter context are inventoried for re‑creation.
- Row‑level security roles — Roles and rules are surfaced for mapping to the target’s security layer.
- Many‑to‑many & bi‑directional relationships — Filter propagation is flagged, so totals can be rechecked on the target.
- Power Query (M) transformations — Native queries and complex transforms are flagged for re‑implementation.
- Pages, visuals & measures — Counted and inventoried, each with an impact rating.
- Tables & hierarchies — Model structure is enumerated, drill paths included.
Every Tableau analysis also includes usage analytics, a dependency graph, and an effort & cost estimate. Every Power BI analysis includes a migration difficulty score for your target, complexity by area, and used vs. unused fields.
How to plan your migration
Plan from evidence. Don't migrate what nobody uses.
The Analyzer turns your estate into a migration plan in four steps — including the one most projects skip: deciding what not to move.
Scan everything
Connect read‑only to Tableau, or upload Tableau workbooks and Power BI reports. Every dashboard, calculation, and data source inventoried in minutes.
Score and sort
Complexity, risk, and usage per workbook — a Migration Readiness Score instead of a guess.
Cut the junk
Orphaned and low-usage dashboards are flagged as de-scope candidates. Don't pay to migrate what nobody opens.
Sequence and budget
An execution order by impact vs. effort, with estimates you can put in front of stakeholders.
How it connects
Read-only. By design.
Read-only access
No write permissions ever requested. On a Tableau connection, Antares reads workbook metadata — structure, calculations, usage stats. Never your underlying business data.
Exportable report
Every analysis ends in an exportable report — ready to present to stakeholders or your migration team.
Tableau Server & Cloud
Connects via the Tableau REST API. Supports Tableau Server (2019.1+) and Tableau Cloud. No agent or on-prem installation required.
Power BI reports
Upload a .pbix file or a zipped PBIP project — no tenant access needed. A .pbix can carry imported data: the Analyzer works from the report and model structure and doesn’t copy data rows into its results.
FAQ
Common questions.
How long does analysis take?
Most environments complete in minutes. Large estates (1000+ workbooks) may take up to 30 minutes.
What access does Antares need?
For Tableau, read-only access to Tableau Server or Tableau Cloud; no write permissions are ever requested. For Power BI, none: you upload the report file instead.
Which BI platforms can the Analyzer assess?
Tableau and Power BI. Connect read-only to Tableau Server or Tableau Cloud, or upload workbooks; for Power BI, upload a .pbix file or a zipped PBIP project, one report per analysis. Each analysis is scored against the target platform you pick, and the home page keeps the current list of supported routes.
Is my data secure?
On a Tableau connection, Antares analyzes workbook metadata — structure, calculations, and usage stats — and never reads your underlying business data. A Power BI file can carry imported data: the Analyzer works from the report and model structure and doesn’t copy data rows into its results.
Can I analyze a subset of workbooks?
Yes. You can filter by project, site, or select individual workbooks for a targeted analysis.
What's in the readiness report?
For Tableau: a Migration Readiness Score per workbook, complexity breakdown by feature type, auto-convertible percentage, effort estimate, and prioritized conversion order. For a Power BI report: a complexity score, a migration difficulty score for the target you pick, the main migration considerations, and a full component inventory.
Can Antares tell us what not to migrate?
Yes. Usage analytics and dependency mapping flag orphaned and low-usage workbooks as de-scope candidates — most estates carry dashboards nobody opens, and you shouldn't pay to move them.
When you're ready to move: conversion is a flat $200€200 per dashboard — see the Converter.
Ready to see your environment?
Run the free Analyzer. No environment changes. No commitment.